If I had to describe my time at Biotz's Summer School, rewarding would be the first word that comes to mind. This summer, I had the opportunity to spend a month at Biotz, an experience from which I took away a huge amount of learning. While it’s true that at the beginning I felt a bit lost due to how challenging and new the environment was, I quickly found support from the team, which makes sense since they live by the idea of “solving real problems from the real world”.
Over this month, I’ve been focusing my research on two trending areas which are the Internet of Things and Smart Homes, both deeply interconnected. Not only have I developed a deeper understanding of how smart home ecosystems work, but I’ve also come to see how important proper data management is. From data acquisition to exploration, data plays a key role since it enhances decision making and helps anticipate problems. Achieving this, however, requires significant effort: understanding different data formats, cleaning and processing information. Moreover, diving into the different machine learning algorithms that can be applied to this field included in the plan too. Exploring these methods has given me a first-hand understanding of how they can transform raw data into meaningful insights which has definitely captured my interest, because I believe it opens up a world of possibilities for the future. Without a doubt, it’s a fast growing field that I intend to keep up with.
Even so, what I take from this experience goes beyond technical knowledge. I’ve had the chance to see how they operate as a team and to get introduced to different programming languages they use like Clojure (which was completely unknown for me). From day one, the team was very approachable, welcoming (as in Oñati’s office) and ready to share their knowledge. I’m grateful that they also allowed me to share some ideas and contribute to one of their projects.
In the next paragraphs, I share the ins and outs of the projects I worked on during the weeks I spent in Biotz summer school.
Smart Home IoT data modeling project
INTRODUCTION - IDEAS FOR THERMOSTATS
My work focused mainly on the process of generating ideas for thermostats, which are supported by Biotz’s IoT Platform. For this purpose, the project relies on data analysis and the search of the most suitable machine learning algorithms for it.The thermostats’ system is equipped with an intelligent hybrid system combining a boiler and a heat pump, thus offering a solution for building energy renovation.
The first part of the document presents the pursued objectives and some initial ideas. Subsequently, the process of data collection, cleaning and processing is outlined. The problems encountered and the challenges in performing an analysis of the data are also discussed. In the final section, the main conclusions and potential ML models that can be used are presented.
It should also be noted that in the search for new ideas, attention has also been given to existing competitor products.
OBJECTIVES - ENERGY EFFICIENCY AND COMFORT
The main objective has been to explore ways of achieving greater energy efficiency, comfort, and automation in smart thermostats through algorithms or Machine Learning models. For this purpose, a descriptive analysis of the data has been required, including their visualization through different tools. However, this objective has not been fully achieved due to the limitations of the available dataset that will later be presented.
To achieve the mentioned objective, one of the ideas has been to predict the Zone X Calculated Setpoint, a parameter already recorded by the thermostat.
DATA INGESTION AND PROCESSING - PLAYING WITH BIOTZ IOT PLATFORM
The main data source that has been used is the one provided by the Swagger of Biotz IoT Platform. From this source, a file has been generated which contains all the parameters collected by the thermostats in a unified manner, from the first to the last record. The provided data model has also been used, this includes each of the parameters collected by the thermostats (and some additional ones), detailing the data type and possible values, among other information. All the available data has been gathered, ranging from June 9, 2025 to July 28, 2025 (Figure 1) at the time of the data collection.
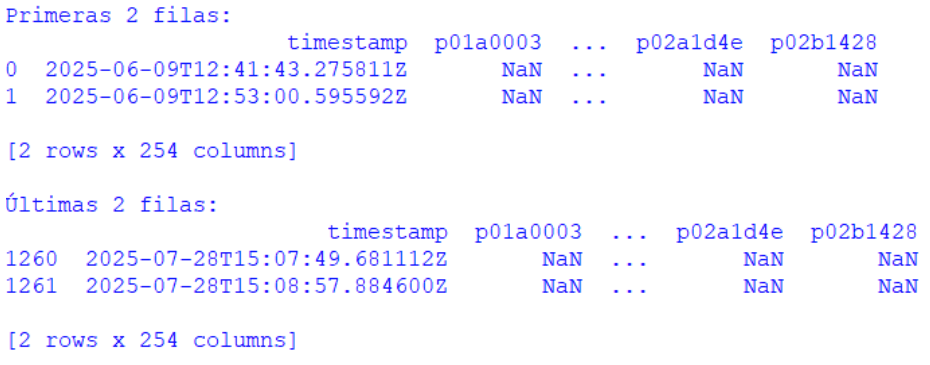
Figure 1-Console visualization of the timestamps of the first and last entries
For the subsequent analysis, data preprocessing has been required. In order to transform the raw data into a clean and structured format, the following basic script has been developed in Python. The script has been used mainly for the cleaning process.
To begin with, the contents of the database have been analyzed in a general way. For this purpose, the first and last rows, as well as the total length (1262 records) have been extracted in order to obtain an overall idea of the dataset.
Subsequently, all columns with entirely null values have been removed. These correspond to parameters for which no data have been recorded and are therefore useless.
In addition, the names of remaining columns have been replaced with labels that provide a clearer representation of the parameters. For instance, “po1a003” has been renamed to “Wifi Signal Strength”, which conveys more accurately the nature of the information. (Figure 2)

Figure 2-Part of the script with the deletion and renaming of parameters
After this first column filtering, and keeping efficiency, energy saving and comfort as the main objectives, further columns (Figure 3) have been removed due to their lack of relevance for the intended analysis. For example, device Firmware Version and Wifi Signal Strength can be used for error prevention or performance of the device, but they have not been considered as essentials for energy efficiency or comfort.
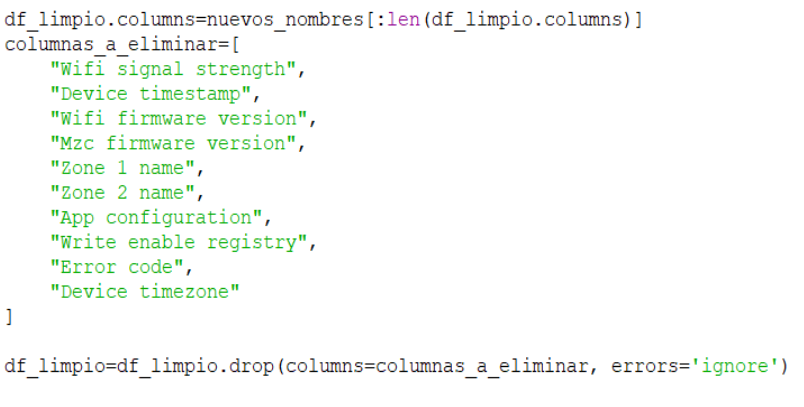
Figure 3-Removal of non-useful parameters
Finally, a summary of remaining data has been generated in order to gain a second overview of the dataset. This summary also includes statistics such as the percentage of not null values for each variable (Figure 4).
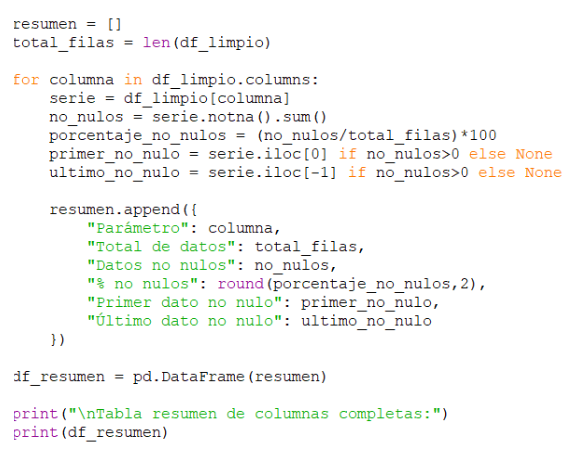
Figure 4-Generation of the summary reflecting the reality of the remaining data
In parallel, two xlsx files have been generated: one containing the summary table described above, and the other containing the dataset after the two cleaning processes.
As explained before, the summary includes, among other measures, the percentage of usable (non-null) data. This highlights the first issue: most parameters contain less than 30% of non-null values. It should also be noted that outliers have not yet been handled in this stage.
The second issue (and probably the most critical) has appeared when attempting to visualize certain parameters as a time series. Since “Zone 1 Temperature” is among the variables with the highest proportion of non-null values, it has been selected as a test case. However, when plotted (Figure 5), the result has not been as expected. Despite more than one month between the first and last recorded data points, the dataset only contains measurements of four specific days: June 9, July 3, July 14 and July 28. In other words, all data are concentrated on just these four dates, which introduces a significant sampling bias and makes it impossible to do a meaningful analysis of changes across a full month.
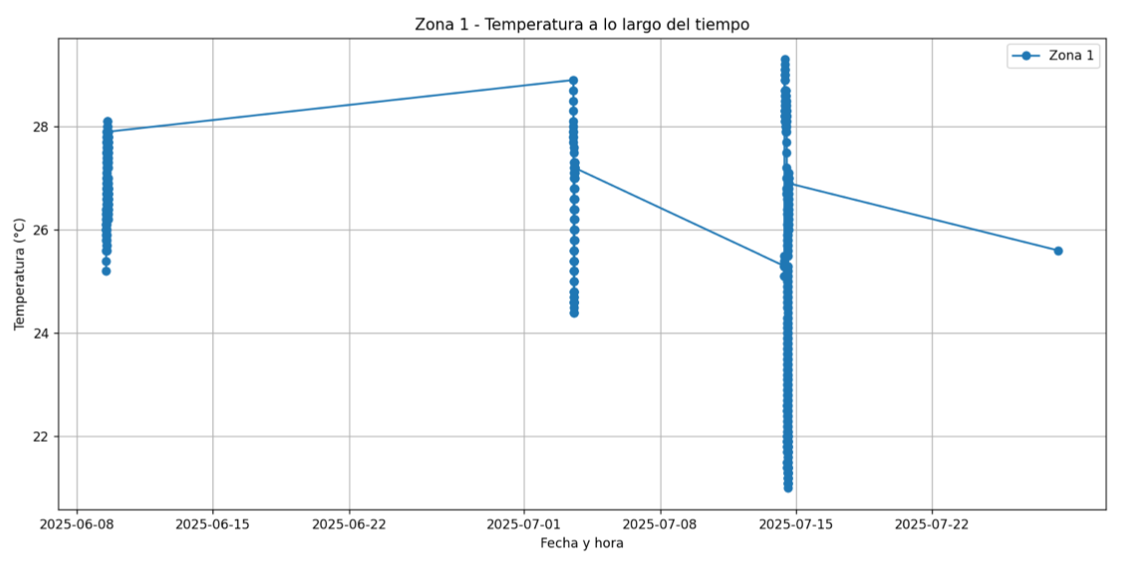
Figure 5-Plot of the time series
Because of these limitations, it is not possible to generate boxplots or histograms that reflect the actual distribution of the collected data. Consequently, it is also not feasible to reliably select the most appropriate Machine Learning models for the prediction tasks.
Moreover, it was intended to validate the performance of (both linear and non-linear) selected ML algorithms using metrics such as RMSE, applied during training and evaluation to assess predictive accuracy.
Nevertheless, some models have been considered for exploratory purposes. Although these are unreliable due to the lack of validation, they may still serve as a brainstorming tool for identifying potential new approaches.
PROPOSED MODELS
With the objective of obtaining results that are as closely aligned as possible with the user’s behavior and preferences, a mixed option is proposed which combines basic and automatic rules with techniques related to Machine Learning, including both supervised and unsupervised algorithms. This combination makes it possible to build an efficient and personalized system.
To start with, basic rules or hard rules are essential for the safety of the system. These rules include for example, minimum and maximum temperature limits and/or restrictions on the rate of change of the setpoint. These don’t replace Machine Learning techniques but they create a safe set of rules so the models can work without making unsafe choices.
On the one hand, it is important to predict different values. Among the most interesting is predicting the “Zone X Calculated Setpoint”, one of the parameters recorded in the database. By forecasting this value, maximum comfort can be achieved with minimum consumption, since it allows us to anticipate that target using pre-cooling or pre-heating during off-peak hours. Another value of interest is the time it takes for the home/room to reach the desired temperature. For this type of continuous prediction, supervised regression models are most recommended. When the relationship between variables is approximately linear, linear or multiple regression fits well. However, for nonlinear relationships, Decision Trees or Random Forest are more useful, and Gradient Boosting is also usable.
These predictions can be complemented by integrating external data, such as climate information (outside temperature, humidity, or weather forecasts) to anticipate the impact of the environment on the home. For example, the Spanish Red Eléctrica provides APIs of this type. Likewise, incorporating real-time electricity price APIs would make it possible to optimize the timing of HVAC cycles, maximizing cost savings without sacrificing comfort.
Classification also plays a very important role as a supervised model for discrete parameters that indicate the operating mode of the home, such as Holiday Mode or Summer-Winter mode. In these cases, Decision Trees or Random Forest can predict the most suitable mode depending on the context.
In addition, a potential idea is to integrate a user calendar API to determine whether the user will be at home or away due to scheduled events or longer periods of time, thus enabling prediction of the Holiday Mode. In fact, the thermostat already records parameters such as “Holiday Mode End Date” and “Holiday Mode End Time”. By combining these with calendar information, it is possible to adjust the temperature: maintaining energy savings during no presence time and ensuring that at the exact moment of return, the home is at the adequate comfort temperature.
Beyond these techniques, there are Reinforcement Learning models. While regression or classification predict numbers, this method learns how to control the system by trying things out in the environment. In this way, the system could automatically discover rules for turning the HVAC system on or off at strategic times, simultaneously balancing comfort and energy cost.
On the other hand, unsupervised models such as clustering make it possible to find hidden patterns in user behavior and generate personalized profiles according to their preferences. Combined with supervised models, this improves the prediction of modes (zone off, temporarily manual, etc.). As part of clustering, DBSCAN is useful for users with atypical behaviors, while K-means is ideal for grouping usage patterns and modeling general comfort preferences.
Apart from prediction, XAI mechanisms can also be integrated. This refers to “the set of processes and methods that allows human users to understand and trust the results and outputs created by machine learning algorithms.” In this way, user trust and transparency are increased. For example: “The temperature was lowered because the electricity tariff will decrease in 30 minutes.”
Finally, the system could incorporate key performance indicators (KPIs) and usage statistics that allow the user to easily visualize their level of savings and efficiency. For instance, it could show weekly or biweekly energy and cost savings in a visual, intuitive and reliable way. For the visualization of this data, tools such as Grafana are highly suitable, as they enable clear and interactive dashboards that demonstrate the system’s efficiency.
CONCLUSION - PERSONALIZED COMFORT
Although it has not been possible to test the models due to issues found with the Test data, this work has served to present some novel ideas that could enrich the development of the system. Among them, notable examples include the integration of a user calendar API and the use of clustering techniques to profile users and achieve truly personalized comfort.
Furthermore, this brief report also highlights the importance of smart homes today and their huge potential for the future. Systems like the one described here not only enable a higher level of personalized comfort but also promote energy efficiency and consequently, economic savings. At the end of the day, smart homes are a key component in the future of our society.
Finally, I hope that the ideas presented can support the project and contribute something new. I am very grateful for the given opportunity.
.jpg)